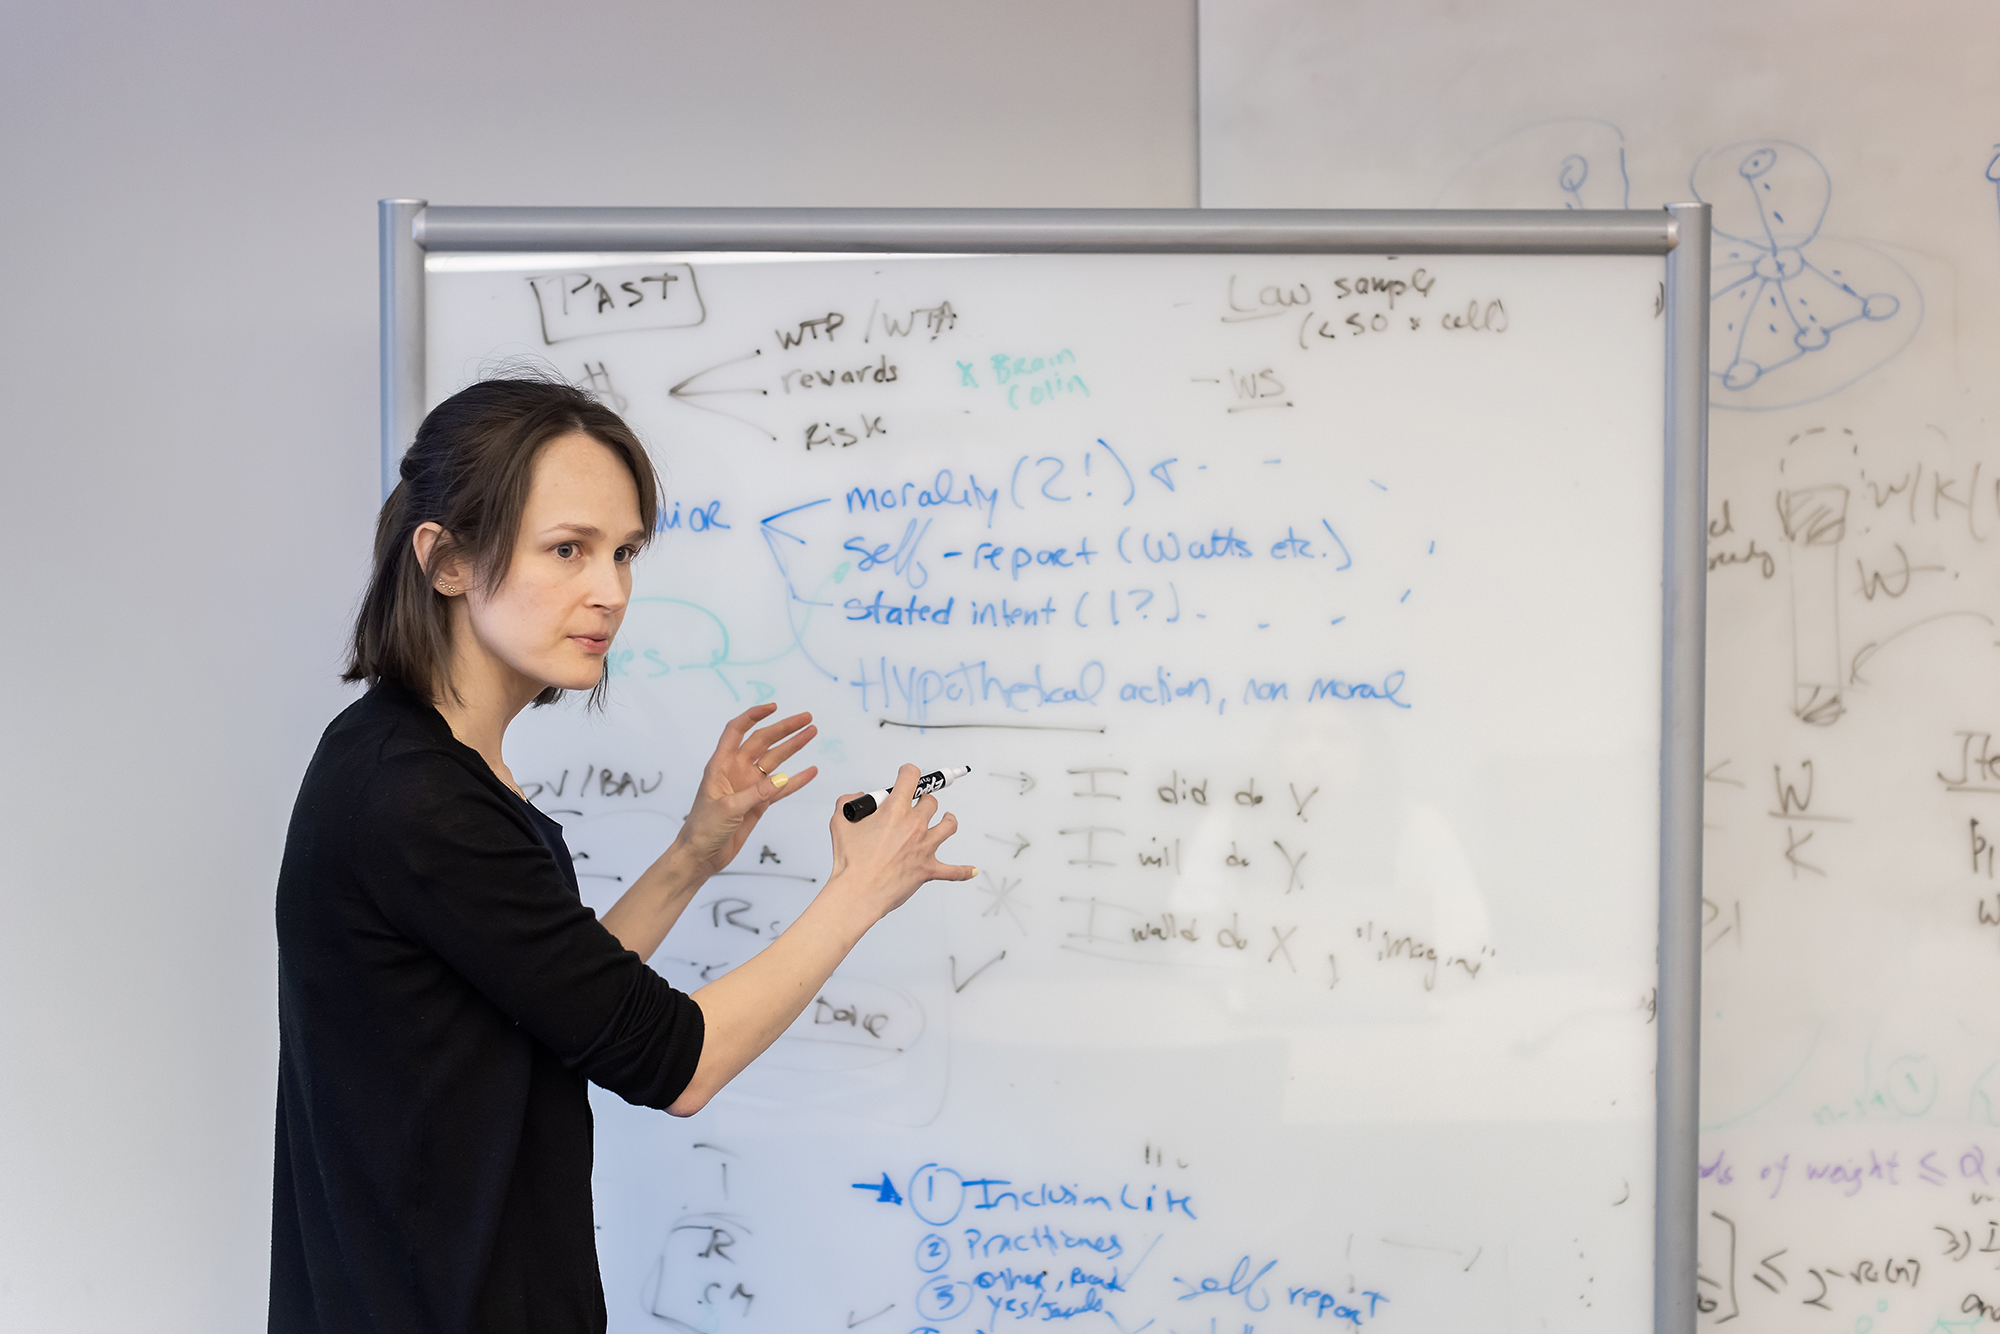
A nudge, explains Linnea Gandhi, a Ph.D. candidate at the Wharton School, is generally a small change to the elements around a person’s decision.
“Nudges change some part of the context around a target choice or behavior, so that people are more likely to do the right thing,” says Gandhi. “They’re often small and low-cost, so they’re really attractive to business leaders and policymakers who want to improve outcomes without spending a lot of money.”
Policymakers may seek science-driven strategies to change some behavior that could lead customers to choose environmentally friendly products, encourage patients to maintain medications, or spur employees to comply with safety procedures.
Nudges can take many shapes and forms, inspired by academic theories, Gandhi explains. “If you’re a CEO who wants your employees to eat healthier at the company cafeteria, you might organize the buffet line differently,” Gandhi says. “Healthier foods could be placed up front, or have green-colored tongs, or have more attractive descriptions. And what’s really powerful is that all these examples actually come from academic papers.”
Gandhi is part of Wharton’s Operations, Information and Decisions Department and in the Computational Social Science Lab (CSSLab), is leading a project called Nudge Cartography. “As the name suggests, we aim to map studies of various nudges. This work will provide researchers and policymakers with a framework for finding the most effective nudges for a specific use case.”
The challenge is in wading through all those papers to find the right nudge for the right context. Since the concept of a nudge was formalized in 2008 by Nobel Laureate Richard Thaler and Harvard University professor Cass Sunstein, researchers have published hundreds of experiments innovating around the concept. Hundreds more exist in the public and private annals of organizational “nudge units.”
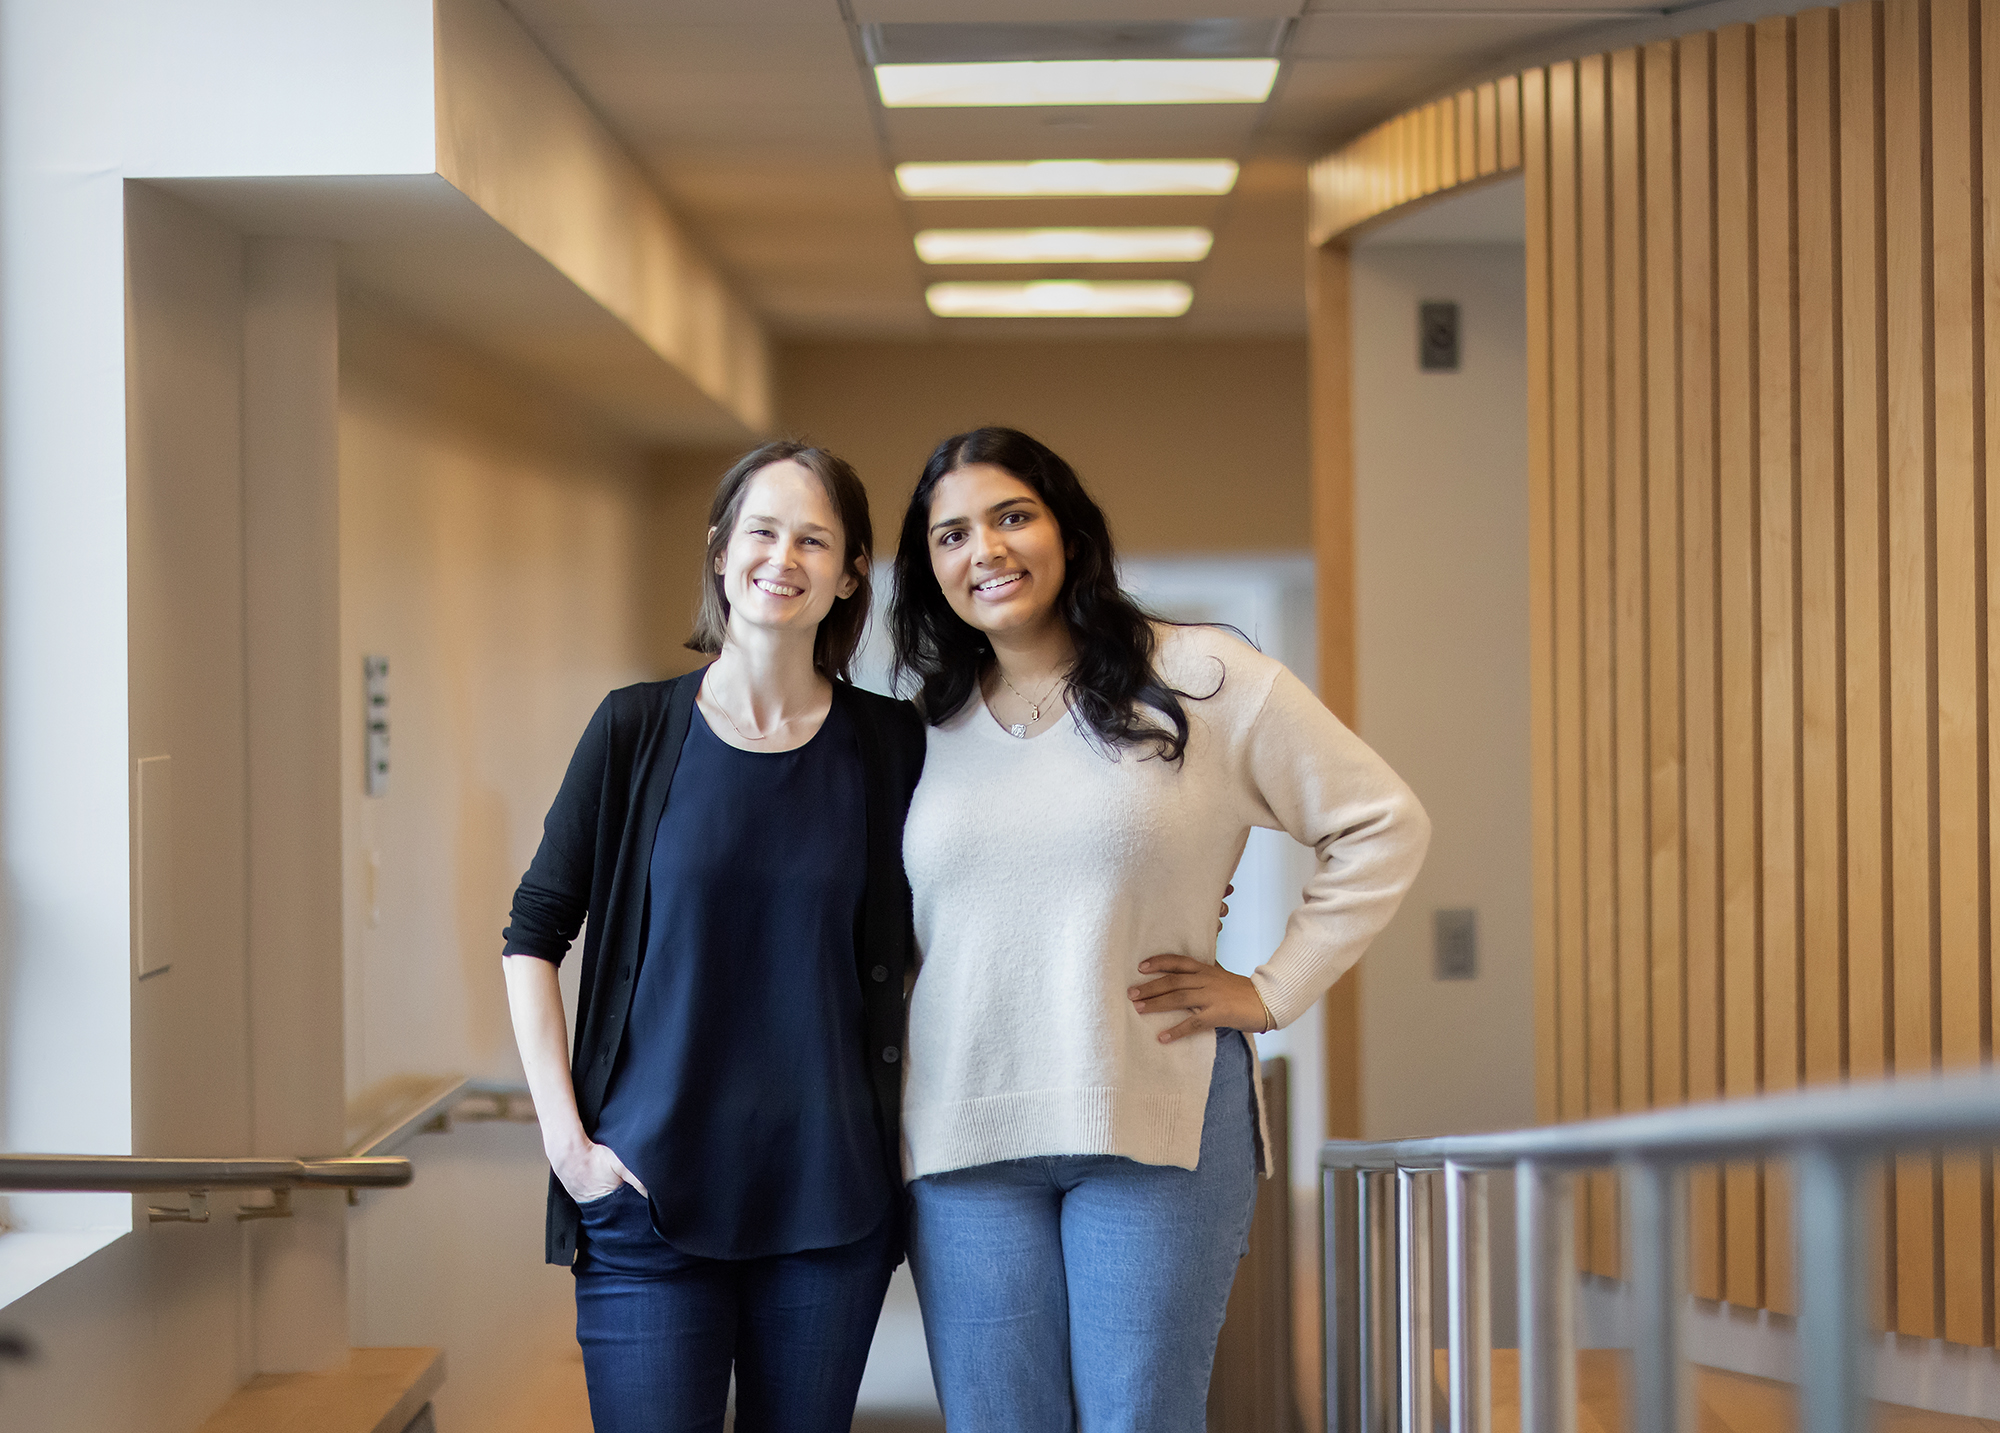
Anoushka Kiyawat, a May graduate from the Behavioral and Decision Sciences (MBDS) program in the School of Arts & Sciences and research assistant in the CSSLab, points out that countries, contexts, behaviors, and the nudges themselves vary from experiment to experiment.
“No one has the time to read everything that’s been published on nudging or choice architecture,” Kiyawat says. “And even if they did, they’re not going to find one that perfectly fits what they’re looking for and they’re going to have to do some guessing for whatever their context is.”
She explains that matters are further complicated by whether these published findings work when applied to new settings, and that in recent years, interventions based on psychological theories, including nudges, have come under increased scrutiny as classic findings have failed to generalize.
“More and more evidence is coming out that context deeply matters for whether a nudge, or choice architecture intervention more broadly, is going to change a given behavior,” says Gandhi. In one example, mailed reports comparing homeowners’ energy use to that of their neighbors—a nudge called “social proof”—tend to work better in more progressive, wealthy neighborhoods.
“I ran into this all the time in my prior career consulting,” she adds. “We would get all excited about an impressive result in a paper, and then it would totally flop. Social proof is a great example: It worked really well trying to get primary care physicians to adopt clinical standards but backfired with specialists. And in some therapeutic areas it didn’t help anyone. It’s really discouraging when academic insights don’t just copy-paste, and you don’t know why.”
The solution? Build a map
Gandhi brought this frustration with her when leaving the industry to join the Ph.D. program at Wharton, eventually teaming up with Duncan Watts, a Penn Integrates Knowledge Professor with appointments in the Schools of Engineering and Applied Science, the Annenberg School for Communication, and Wharton. Watts oversees the Computational Social Science Lab and works on projects to improve social science practices.
Inspired by Watts’ development of integrative experimentation, Gandhi realized that the root of the problem with nudges was the way in which knowledge about them was stored.
“It’s kind of ridiculous that in an age of massive sets of structured data we still capture scientific findings in unstructured prose,” she says. “Papers can be fun to read, but good luck trying to make sense of them collectively. They’re written in wildly different ways, use different words to mean the same thing, and don’t even have space to document all the details of what happened.”
This makes it nearly impossible to draw reliable comparisons between studies about which nudge works in which context in an apples-to-apples kind of way, she explains.
The key to solving issues with the generalizability of nudges, Gandhi realized, was to first solve the problem of their comparability. “To figure out which nudges would work in which contexts, we needed to systematically organize all the findings about them, and in a way that everyday people could actually navigate. We needed a map.”
Gandhi decided to dedicate her Ph.D. to building this map using computational methods and a product-centric philosophy. The Nudge Cartography project began in early 2022 and quickly attracted a talented set of research assistants from Penn’s Master of Behavioral and Decision Sciences program, many of whom shared Gandhi’s original frustration with the literature.
Kiyawat even joined before her program started: “I think a lot of our team had some experience, across academia and industry, with this sense of frustration with the literature,” she shares. “Each study could be super clever and well-designed, but still fail to replicate or generalize in a way that’s useful in real life. This project has been a great place for us to be able to feel like we’re doing something to tackle this issue.”
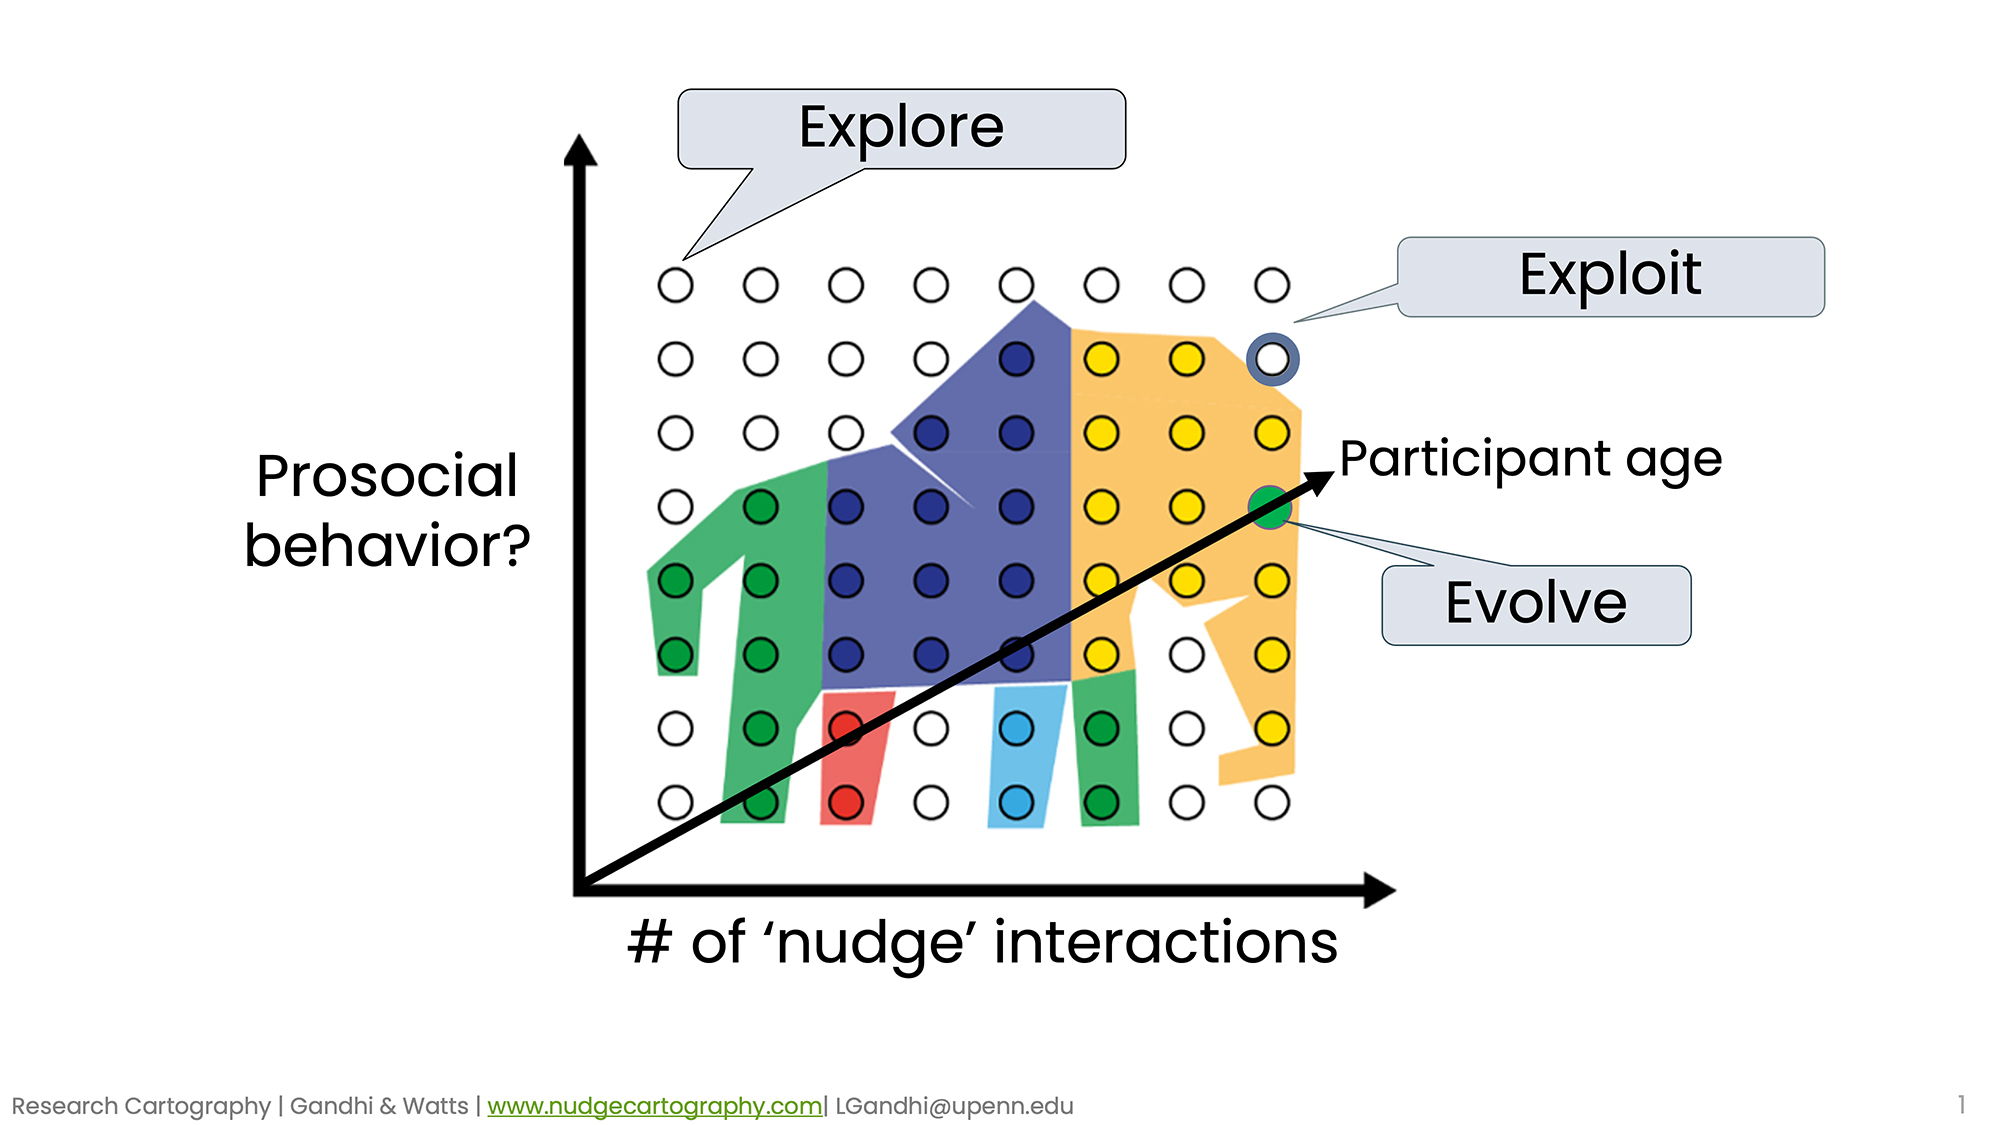
The central idea behind the project is to treat knowledge like a physical space, Gandhi iterates. She likens cities and towns to how different findings from a variety of experiments can be mapped closer or farther apart.
“But rather than simple longitude and latitude, the coordinates include the many multifaceted factors that can vary from experiment to experiment, including demographics, geographies, types of nudges, and much much more,” she says.
Building a factory for turning papers into knowledge
Defining this list of factors isn’t easy, and the team iterated on it for nearly a year while mapping the first batch of experiments. They liken the process to being a detective, trying to make sense of varied sources of evidence.
“Prior to joining this project I’d read my fair share of studies and remember and thinking that it wouldn’t be that difficult to read and code them … I couldn’t have been more wrong,” Kiyawat says.
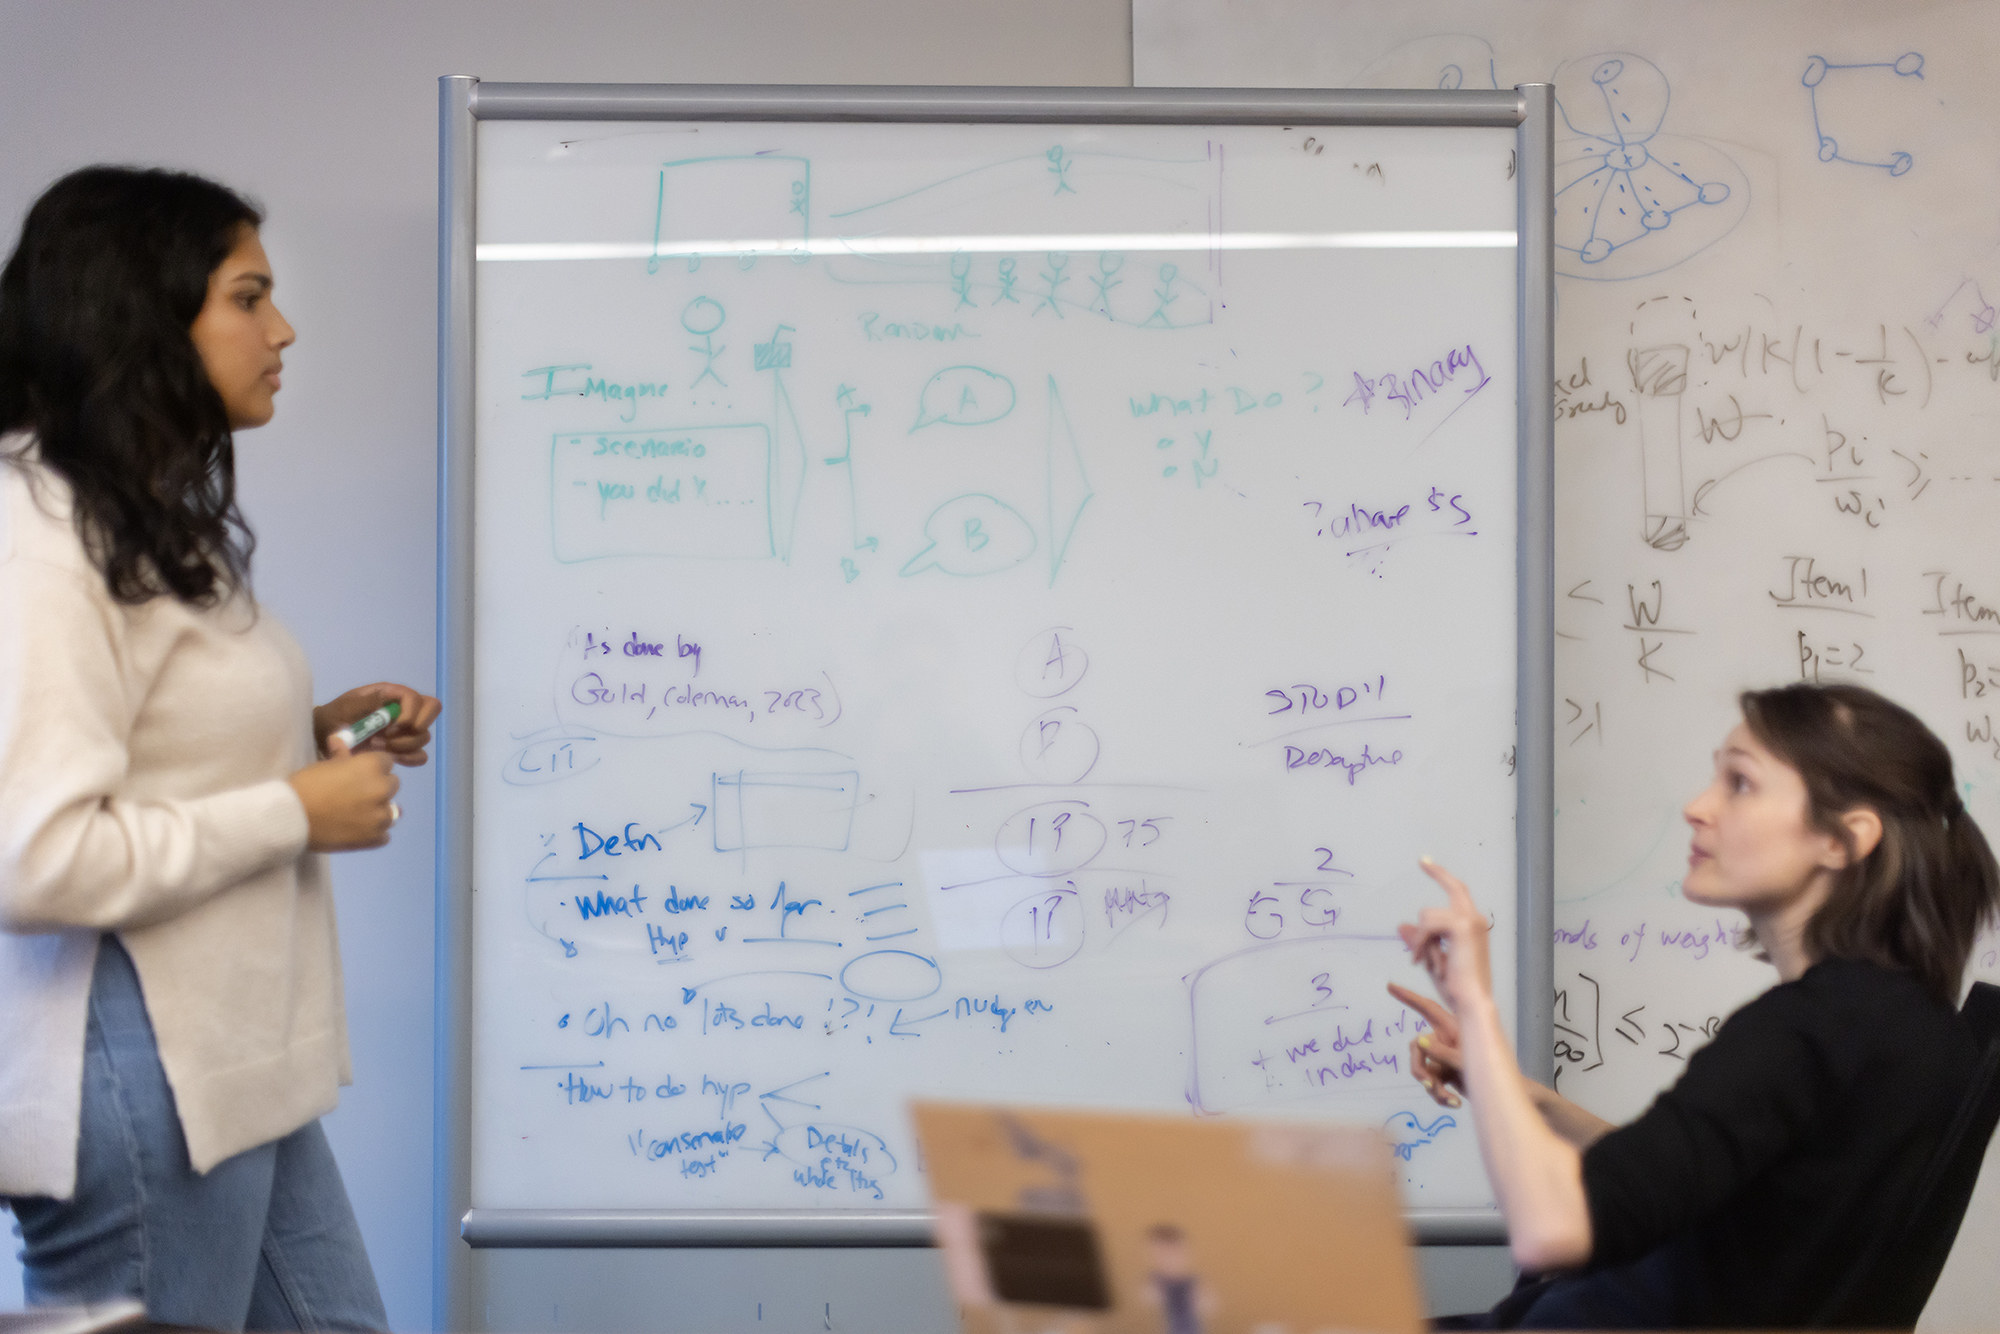
“It was a long process, and I remember times where we had to literally draw studies out by hand, a lot like in ‘A Beautiful Mind,’ to understand how they worked and how we could code them up. We could read studies 10 times over and still find new details every time.”
In looking for something as simple as the sample size, Gandhi explains, the team could find it in the prose, a table, a footnote, or an online appendix. Sometimes, the sample size for every variable, with and without attrition, aren’t provided, which meant she and the team had to reach out to the original authors.
“So, when someone asks, ‘Well, what’s the sample size of that study?’ I can give you four different numbers,” Gandhi jokes.
The complexity of the problem has meant establishing a series of workflows, templates, and audit processes much like you might see on a factory floor. It takes three to four hours to fully code an experiment across hundreds of variables, come to consensus, and sign off on it. And, Gandhi notes, that doesn’t include the time spent building and iterating the coding infrastructure, or reviewing coded data with the original authors.
Fortunately for the team, the popularization of large language models (LLMs) has opened new opportunities to streamline their work.
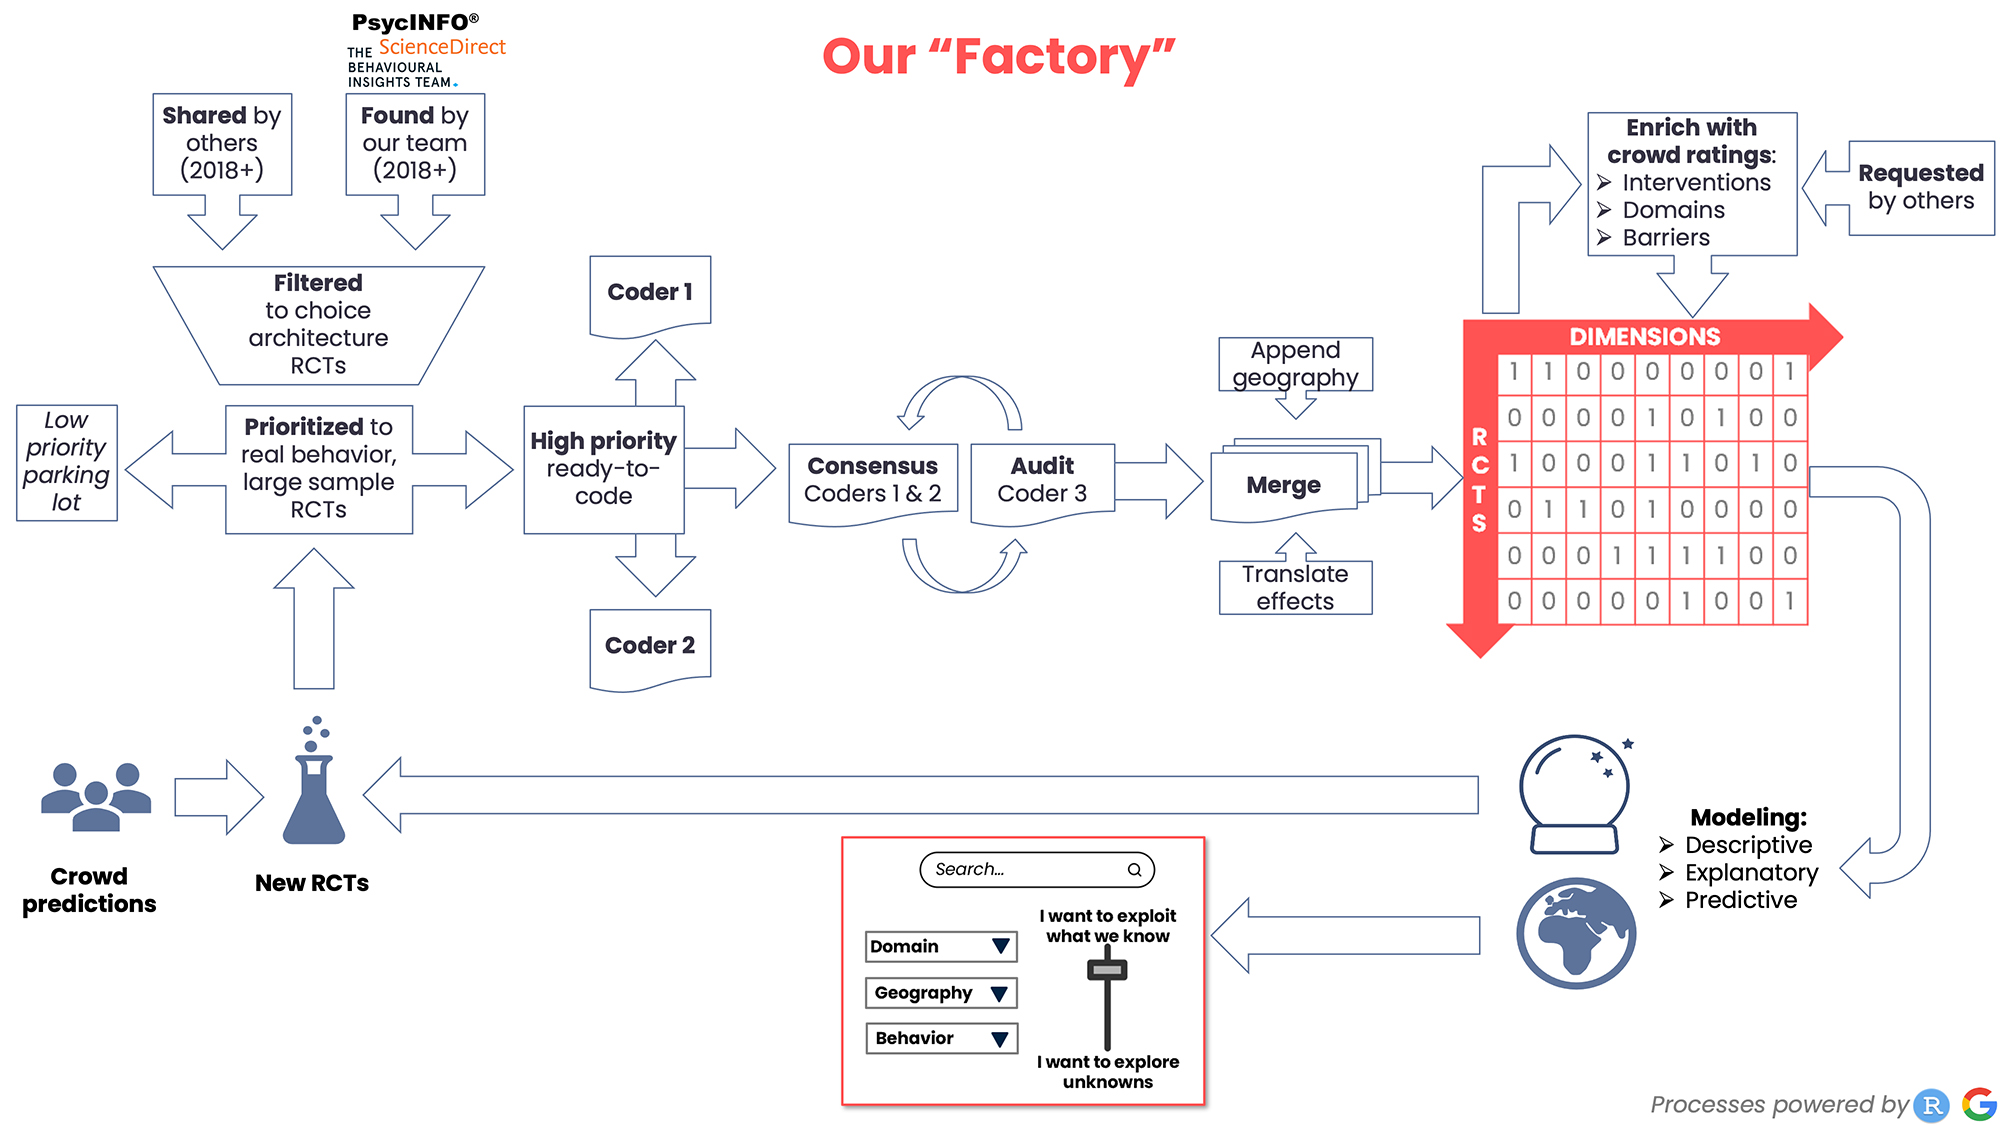
“Being able to outsource even a first pass of coding to a LLM would be game-changing,” says Gandhi. “We’re testing a few pipelines out this summer, as well as talking with potential partners. It’s really complex though because if you think of us like a factory—ingesting papers and producing data—we’re trying to upgrade the equipment without sacrificing our current productivity.”
The team hopes to have integrated AI into some of their steps by early fall, as they start to code a new batch of experiments from academic publications and practitioner organizations.
Says Watts, “Nudge cartography sounds straightforward, but it involves nothing less than reconstructing an entire field of research in a new way. It’s been a Herculean effort and I expect Linnea and Anoushka’s contribution to have a major impact on nudging, and more generally on empirical social science.”
The way forward
Gandhi explains that the novelty of the nudge cartography database lies in the dimensionality she and her team have added to make it something that is “living, continuous, and eventually, predictive."
“We’re not stopping at a database,” Gandhi says. “We’re interested in what it can do—find gaps in the literature, develop new theories, predict new experiments. Our end goal is to make this a public good we want everyone to be able to use, which will eventually give rise to more and better research.”
Throughout the summer, Gandhi and her team have been hard at work cleaning data, performing maintenance on the database, and exploring automation. Additionally, Gandhi has presented the research at several conferences and will continue sharing findings at industry talks abroad with the hope of attracting more collaborators and funding sources.
“I’m really excited for the coming months,” says Gandhi. “It’ll be great to show the world what our tool’s capable of and the promise it holds to unlock all the knowledge stuck in papers and make it open, navigable, facilitating truly cumulative science.”